Stock Advisory8 min readAugust 24, 2026
Understanding F&O Open Interest: What Institutional OI Tells You
Comprehensive guide to interpreting Open Interest in Nifty, Bank Nifty, and F&O shares to trade alongside institutional money flow.
S
Sagar Sharma Vats
NISM Certified Research Analyst • Reg No: NISM-202500239619
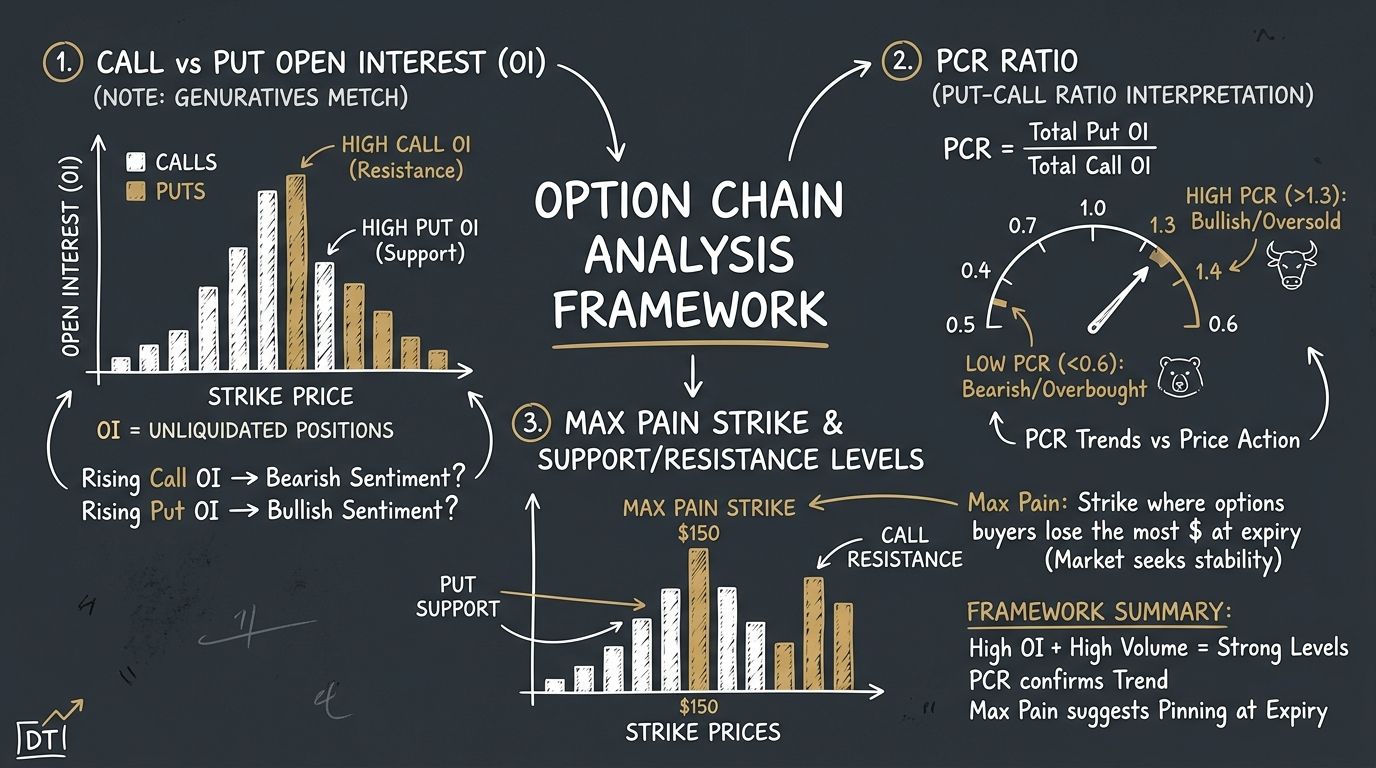
Open Interest (OI) represents the total number of outstanding futures and options contracts held by market participants. Understanding institutional OI shifts allows traders to track smart money capital flows before big directional moves occur.
1. Decoding Institutional Open Interest (OI) Signals
Unlike volume (which measures daily transaction count), Open Interest measures net active capital committed to the market:
- Cumulative Open Interest: Tracks total contracts across current, next, and far month contracts.
- OI Change Rate: Rapid spikes in OI indicate institutional position building before major events or earnings announcements.
- Rollover Percentage: High rollover rates into the next expiry month indicate institutional conviction to carry positions forward.
Institutional Derivatives Watchlist
SBINNSE / BSE
State Bank of India
Market Price
₹825.60
+6.40 (+0.78%)Validd Target
₹940.00
Signal: BULLISHRELIANCENSE / BSE
Reliance Industries Ltd
Market Price
₹1,385.40
+14.20 (+1.04%)Validd Target
₹1,650.00
Signal: BULLISH2. Difference Between Volume and Open Interest in Derivatives
Understanding the relationship between volume and OI prevents false breakout traps:
- Volume without OI Increase: Day trading churn without long-term position building.
- Volume with High OI Increase: True institutional accumulation or distribution.
- High Rollover + Rising Price: Bullish continuation into the upcoming series.
Institutional OI vs Price Signal Matrix Table
| Open Interest Shift | Volume Trend | Price Action | Institutional Sentiment | Action Plan |
|---|---|---|---|---|
| Expanding (+12%) | High | Rising | Strong Accumulation | Buy on Dips |
| Expanding (+15%) | High | Falling | Heavy Distribution | Short on Rallies |
| Contracting (-8%) | Low | Rising | Weak Short Covering | Tighten Stop-Loss |
| Contracting (-10%) | Moderate | Falling | Long Liquidation | Exit Long Positions |

SEBI Analyst Pro Tip: Always analyze cumulative OI across all three active expiry contracts (Near, Next, and Far) for complete institutional positioning clarity.