Stock Advisory8 min readAugust 24, 2026
How to Identify Long Buildup in F&O Stocks: The Price vs OI Matrix
Learn the 4 quadrants of derivative analysis: Long Buildup, Short Buildup, Short Covering, and Long Unwinding with real-world examples.
S
Sagar Sharma Vats
NISM Certified Research Analyst • Reg No: NISM-202500239619
Long Buildup is one of the most powerful bullish setups in derivative trading. It occurs when both stock price and Open Interest (OI) increase simultaneously, indicating institutional buying and aggressive long position building.
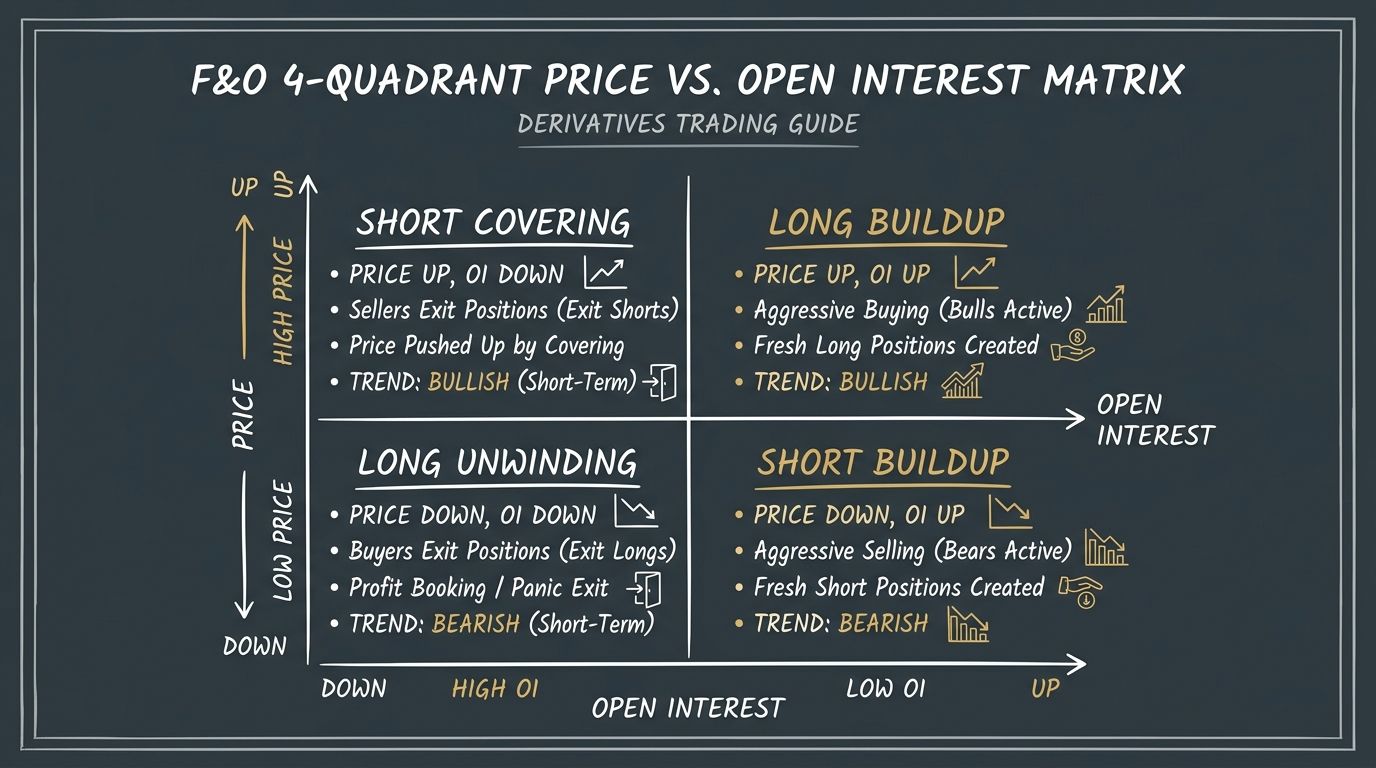
1. The F&O 4-Quadrant Price vs Open Interest (OI) Matrix
Derivative traders categorize price and OI movement into four distinct quadrants:
- Long Buildup (Price UP + OI UP): Aggressive institutional long entry. High probability bullish continuation.
- Short Buildup (Price DOWN + OI UP): Aggressive short selling by institutions. High probability bearish breakdown.
- Short Covering (Price UP + OI DOWN): Traders closing short positions. Temporary relief rally.
- Long Liquidation (Price DOWN + OI DOWN): Long holders exiting positions. Profit taking or stop-loss trigger.
F&O Long Buildup Screening Instruments
ICICIBANKNSE / BSE
ICICIBANK NSE Equity
Market Price
₹1,250.00
+6.50 (+0.52%)Validd Target
₹1,450.00
Signal: BULLISHAXISBANKNSE / BSE
AXISBANK NSE Equity
Market Price
₹1,250.00
+6.50 (+0.52%)Validd Target
₹1,450.00
Signal: BULLISH2. Combining Price Breakouts with Cumulative OI Acceleration
To trade Long Buildup setups with high win rates:
- Identify Price Breakout: Wait for the stock price to break above a multi-week resistance level.
- Confirm OI Surge: Ensure Open Interest increases by at least 8% to 15% on the breakout day.
- Volume Spike: Volume should exceed the 20-day average volume by 2x.
F&O 4-Quadrant Derivative Interpretation Table
| Quadrant Setup | Price Action | Open Interest (OI) | Market Interpretation | Recommended Trade |
|---|---|---|---|---|
| Long Buildup | ⬆️ Rising | ⬆️ Increasing | Institutional Buying | Buy / Go Long |
| Short Buildup | ⬇️ Falling | ⬆️ Increasing | Short Accumulation | Sell / Go Short |
| Short Covering | ⬆️ Rising | ⬇️ Decreasing | Short Sellers Exiting | Caution / Quick Scalp |
| Long Liquidation | ⬇️ Falling | ⬇️ Decreasing | Longs Unwinding | Avoid Longs |

SEBI Analyst Pro Tip: Combine Long Buildup signals with stock sector momentum. A Long Buildup signal in an outperforming sector delivers higher multi-day trade confirmation.